flowchart TD
    T["Truth table"] --> w["wff"]
    T["Truth table"] --> s["set of wffs"]
    T["Truth table"] --> a["argument"]
    w --> c["contradiction, tautology, or contingency"]
    s --> i["consistent or not"]
    s --> e["equivalent or not"]
    a --> v["valid or invalid"]
CH3 – Slides
Slides / handouts are available on my website
Abstract
Slides for Ch3 of my logic course.
PL: Truth Tables
Informal Test: Example
- P1. Some basketball players are millionaires.
- P2. Some millionaires have fancy cars.
- C. Therefore, some basketball players have fancy cars.
90% will say “valid” but it is invalid.
Informal Test: Example 2
- P1. If my car is out of gas, then it won’t start.
- P2. My car won’t start.
- C. Therefore, it is out of gas.
Many will say “valid” but it is invalid.
Informal tests
Informal tests (logical intuition, logical imagination) have problems
- Wrong or inconsistent results
- Belief bias: true conclusion therefore valid argument.
- Large arguments
- Abstract content
We want a test that …
- gives consistent results
- tests validity without belief bias
- can be applied to large arguments
- can be formulated about any subject matter
What is a truth table?
We’ve used truth tables already
\[ \begin{array}{c|c} \phi & \neg (\phi)\\ \hline T & F\\ F & T \end{array} \]
\[ \begin{array}{c c|c c c c} \phi&\psi&\phi\wedge \psi&\phi\vee \psi&\phi \to \psi&\phi\leftrightarrow \psi\\ \hline T&T&T&T&T&T\\ T&F&F&T&F&F\\ F&T&F&T&T&F\\ F&F&F&F&T&T \end{array} \]
Using table to test arguments
- Gives consistent results
- Finite mechanical method (no bias)
- Works on large arguments
- Works on any subject matter
- “Is the argument valid?” Always gives “yes” or “no” answer
The plan.
- Use tables to determine T-value of any wff (under single interpretation)
- Use tables to determine T-value of any wff (under every interpretation)
- Use table as a tool to check validity (and other stuff)
Truth Tables: Step by Step
- Write down the wff.
- Write the truth value (\(T\) or \(F\)) under each propositional letter in the wff for each interpretation \(\mathscr{I}\).
- Assign \(T\) or \(F\) to subformulas in the order that the wff is constructed using (1) the values assigned to the subformulas used to construct that wff and (2) the valuation function assigned to the operator added to the subformula constructed.
Step 1
Let’s create a truth table for this wff: \(P\land \neg Q\)
- Step 1: Write down the wff with each propositional to the left of it
\[ \begin{array}{c c|c c c c} P&Q &P& \land & \neg & Q\\\hline & & & & \\ \end{array} \]
Step 2
Step 2: Get an interpretation of the propositional letters and write it under the letters. - Let \(\mathscr{I}(P)=T\) and \(\mathscr{I}(Q)=F\).
\[ \begin{array}{c c|c c c c} P&Q &P& \land & \neg & Q\\\hline T&F & & & \\ \end{array} \]
write the T-values under the letters of \(P\land \neg Q\).
\[ \begin{array}{c c|c c c c} P&Q &P& \land & \neg & Q\\\hline T&F &T & & &F\\ \end{array} \]
Step 3.1: Calculate the truth table
- Step 3.1: Construct the formula using formation rules.
\[ \begin{array}{c c|c c c c} P&Q &P& \land & \neg & Q\\\hline T&F &T & & &F\\ \end{array} \]
- \(P, Q\) are wffs.
- If \(Q\) is a wff, then \(\neg Q\) is a wff.
- If \(P\) and \(\neg Q\) are wffs, then \(P\land \neg Q\) is a wff.
Step 3.2: Calculate the truth table
Assign truth values to the subformulas in the order in which you constructed the formula
- Assign T-values to \(P\) and \(Q\). DONE!
- Assign T-value to \(\neg Q\)
- Assign T-value to \(P\land \neg Q\)
\[ \begin{array}{c c|c c c c} P&Q &P& \land & \neg & Q\\\hline T&F &T & & &F\\ \end{array} \]
Truth Tables for the Operators
\[ \begin{array}{c|c} \phi & \neg (\phi)\\ \hline T & F\\ F & T \end{array} \]
\[ \begin{array}{c c|c c c c} \phi&\psi&\phi\wedge \psi&\phi\vee \psi&\phi \to \psi&\phi\leftrightarrow \psi\\ \hline T&T&T&T&T&T\\ T&F&F&T&F&F\\ F&T&F&T&T&F\\ F&F&F&F&T&T \end{array} \]
Step 3.2: The Negation
\[ \begin{array}{c c|c c c c} P&Q &P& \land & \neg & Q\\\hline T&F &T & & &\color{blue}{F}\\ \end{array} \]
\[ \begin{array}{c|c} \phi & \neg (\phi)\\ \hline T & F\\ F & T \end{array} \]
\[ \begin{array}{c c|c c c c} P&Q &P& \land & \neg & Q\\\hline T&F &T & & \color{blue}{T}&F\\ \end{array} \]
Step 3.2: Illustrated
\[ \begin{array}{c c|c c c c} P&Q &P& \land & \neg & Q\\\hline T&F &\color{blue}{T} & & \color{blue}{T}&F\\ \end{array} \]
We have the truth value of \(P\) and \(\neg Q\).
\[ \begin{array}{c c|c c c c} \phi&\psi&\phi\wedge \psi&\phi\vee \psi&\phi \to \psi&\phi\leftrightarrow \psi\\ \hline \color{blue}{T}&\color{blue}{T}&\color{blue}{T}&T&T&T\\ T&F&F&T&F&F\\ F&T&F&T&T&F\\ F&F&F&F&T&T \end{array} \]
\[ \begin{array}{c c|c c c c} P&Q &P& \land & \neg & Q\\\hline T&F &T & \color{blue}{T}& T&F\\ \end{array} \]
Reading the Table
What is the truth value of \(P\land \neg Q\)? \[ \begin{array}{c c|c c c c} P&Q &P& \land & \neg & Q\\\hline T&F &T & \color{blue}{T}& T&F\\ \end{array} \]
The truth value of \(P\land \neg Q\) is under its main operator.
Example 2
- “It is NOT the case that Tek is smart iff he’s rich.”
- Translation: \(\neg (S\leftrightarrow R)\)
- Facts: Tek is smart but he’s not rich.
- Interpretation: \(\mathscr{I}(S)=T\), \(\mathscr{I}(R)=F\)
Example 2 - Step 1
Step 1: Write out the formula with the individual letters to the left.
\[ \begin{array}{cc|c c c c} S&R& \neg &(S & \leftrightarrow & R)\\\hline T&F&&&& \end{array} \]
Truth Table: An Example
Next, consider how \(\neg (S \leftrightarrow R)\) is constructed.
- \(S, R\) are wffs.
- If \(S, R\) are wffs, then \((S \leftrightarrow R)\) is a wff.
- If \((S \leftrightarrow R)\) is a wff, then \(\neg (S \leftrightarrow R)\) is a wff.
Assign truth values to the subformulas of \(\neg (S \leftrightarrow R)\) in that order.
Truth Table – An Example
Start by writing truth values under the proposition letters in the wff. \(\mathscr{I}(S)=T\) and \(\mathscr{I}(R)=F\).
\[ \begin{array}{cc|c c c c} S&R& \neg &(S & \leftrightarrow & R)\\\hline T&F&&&&\\ \end{array} \]
Write the T-values under \(S\) and \(R\) under the wff.
\[ \begin{array}{cc|c c c c} S&R& \neg &(S & \leftrightarrow & R)\\\hline T&F&&T&&F\\ \end{array} \]
Example 2
The next wff constructed is \((S \leftrightarrow R)\).
\[ \begin{array}{cc|c c c c} S&R& \neg &(S & \color{blue}{\leftrightarrow} & R)\\\hline T&F&&\color{blue}{T}&&\color{blue}{F}\\ \end{array} \]
To determine whether \((S \leftrightarrow R)\) is T or F, look at the truth table where the leftside of the biconditional is T and the rightside is F:
\[ \begin{array}{c c|c c c c} \phi&\psi&\phi\wedge \psi&\phi\vee \psi&\phi \to \psi&\phi\leftrightarrow \psi\\ \hline T&T&T&T&T&T\\ \color{blue}{T}&\color{blue}{F}&F&T&F&\color{blue}{F}\\ F&T&F&T&T&F\\ F&F&F&F&T&T \end{array} \]
Example 2
\[ \begin{array}{cc|c c c c} S&R& \neg &(S & \color{blue}{\leftrightarrow} & R)\\\hline T&F&&\color{blue}{T}&&\color{blue}{F}\\ \end{array} \]
\[ \begin{array}{cc|c c c c} S&R& \neg &(S & \leftrightarrow & R)\\\hline T&F&&T&\color{blue}{F}&F\\ \end{array} \]
\(v(S \leftrightarrow R)=F\)
Truth Table: An Example
The next wff constructed is \(\neg (S \leftrightarrow R)\).
\[ \begin{array}{cc|c c c c} S&R& \color{blue}{\neg} &(S & \leftrightarrow & R)\\\hline T&F&&T&\color{blue}{F}&F\\ \end{array} \]
- We use \((S \leftrightarrow R)\) to construct \(\neg (S \leftrightarrow R)\)
- So, we will use the T-value of \((S \leftrightarrow R)\) to determine the T-value of \(\lnot (S \leftrightarrow R)\).
- Use the T-value under \(\leftrightarrow\) and the valuation for Negation.
Truth Table: An Example
\[ \begin{array}{cc|c c c c} S&R& \color{blue}{\neg} &(S & \leftrightarrow & R)\\\hline T&F&&T&\color{blue}{F}&F\\ \end{array} \]
\[ \begin{array}{cc|c c c c} S&R& \neg &(S & \leftrightarrow & R)\\\hline T&F&\color{blue}{T}&T&\color{red}{F}&F\\ \end{array} \]
\(v\neg(S \leftrightarrow R)=T\)
Example 2
- “It is NOT the case that Tek is smart iff he’s rich.”
- \(v\neg(S \leftrightarrow R)=T\) when \(\mathscr{I}(S)=T\), \(\mathscr{I}(R)=F\)
Let’s Practice 1
- Book, Ex 3.30, p.113 #1
Let’s Practice 2
- Book, Ex 3.30, p.113 #5
Let’s Practice 3
- Book, Ex 3.30, p.113 #10 (this one is challenging)
Next Step
- We can determine if \(\phi\) is T or F under a single interpretation
- We need to determine the truth value of multiple wffs under all admissible interpretations
The Truth-Table Method
The Truth-Table Method
- What we know: How to determine T-value of \(\phi\) under a single interpretation
- Next: How to determine the truth value of wffs under every interpretation
Step 1: Write the wff
Step 1: Write out the wff \(\phi\) and all of the propositional letters in \(\phi\) to the left of \(\phi\).
\[ \begin{array}{c c|c c c c c} P&R&\neg&P&\vee&\neg&R\\ \hline \end{array} \]
Step 2: Every interpretation
Step 2: Write all interpretations for the propositional letters in \(\phi\).
1 Propositional letter
| Interpretation | \(P\) |
|---|---|
| \(\mathscr{I}_1\) | \(T\) |
| \(\mathscr{I}_2\) | \(F\) |
2 Propositional letters
| Interpretation | \(P\) | \(Q\) | \(P\land Q\) |
|---|---|---|---|
| \(\mathscr{I}_1\) | T | T | |
| \(\mathscr{I}_2\) | T | F | |
| \(\mathscr{I}_3\) | F | T | |
| \(\mathscr{I}_4\) | F | F |
3 Propositional letters
| Interpretation | \(P\) | \(Q\) | \(R\) | \((P\land Q)\land R\) |
|---|---|---|---|---|
| \(\mathscr{I}_1\) | T | T | T | |
| \(\mathscr{I}_2\) | T | T | F | |
| \(\mathscr{I}_3\) | T | F | T | |
| \(\mathscr{I}_4\) | T | F | F | |
| \(\mathscr{I}_5\) | F | T | T | |
| \(\mathscr{I}_6\) | F | T | F | |
| \(\mathscr{I}_7\) | F | F | T | |
| \(\mathscr{I}_8\) | F | F | F |
4 Propositional letters
| Interpretation | \(P\) | \(Q\) | \(R\) | \(S\) |
|---|---|---|---|---|
| \(\mathscr{I}_1\) | T | T | T | T |
| \(\mathscr{I}_2\) | T | T | F | T |
| \(\mathscr{I}_3\) | T | F | T | T |
| \(\mathscr{I}_4\) | T | F | F | T |
| \(\mathscr{I}_5\) | F | T | T | T |
| \(\mathscr{I}_6\) | F | T | F | T |
| \(\mathscr{I}_7\) | F | F | T | T |
| \(\mathscr{I}_8\) | F | F | F | T |
| \(\mathscr{I}_9\) | T | T | T | F |
| \(\mathscr{I}_{10}\) | T | T | F | F |
| \(\mathscr{I}_{11}\) | T | F | T | F |
| \(\mathscr{I}_{12}\) | T | F | F | F |
| \(\mathscr{I}_{13}\) | F | T | T | F |
| \(\mathscr{I}_{14}\) | F | T | F | F |
| \(\mathscr{I}_{15}\) | F | F | T | F |
| \(\mathscr{I}_{16}\) | F | F | F | F |
Tip for covering all interpretations
- Start with the rightmost letter, and alternate: TFTFTFTF
- Double the pattern: TT FF TT FF TT FF
- If necessary, double again: TTTT FFFF TTTT FFFF
Exam Tip
Get comfortable with this basic setup:
| \(P\) | \(Q\) | \(P\land Q\) |
|---|---|---|
| T | T | |
| T | F | |
| F | T | |
| F | F |
Applying Step 2
\[ \begin{array}{c c|c c c c c} P&R&\neg&P&\vee&\neg&R\\ \hline &&&&&&\\ \end{array} \]
Write out all the interpretations:
\[ \begin{array}{c c|c c c c c} P&R&\neg&P&\vee&\neg&R\\ \hline T&T&&&&&\\ T&F&&&&&\\ F&T&&&&&\\ F&F&&&&& \end{array} \]
Step 3: Transfer the T-values
Step 3: For each row, write the T-values under the corresponding letter in the wff \(\phi\).
\[ \begin{array}{c c|c c c c c} P&R&\neg&P&\vee&\neg&R\\ \hline T&T&&T&&&T\\ T&F&&T&&&F\\ F&T&&F&&&T\\ F&F&&F&&&F \end{array} \]
Step 4: Table method for each row
Step 4: Assign \(T\) or \(F\) to subformulas in the order that the wff is constructed.
\[ \begin{array}{c c|c c c c c} P&R&\neg&P&\vee&\neg&R\\ \hline T&T&F&T&&F&T\\ T&F&F&T&&T&F\\ F&T&T&F&&F&T\\ F&F&T&F&&T&F \end{array} \]
Step 4: Continued
- We have T-values for \(\lnot P\) and \(\lnot R\).
- Use values under \(\lnot P\) and \(\lnot R\) to determine the T-value of \(\lnot P\lor \lnot R\)
\[ \begin{array}{c c|c c c c c} P&R&\neg&P&\vee&\neg&R\\ \hline T&T&F&T&&F&T\\ T&F&F&T&&T&F\\ F&T&T&F&&F&T\\ F&F&T&F&&T&F \end{array} \]
Step 4: Continued
\[ \begin{array}{c c|c c c c c} P&R&\neg&P&\vee&\neg&R\\ \hline T&T&\color{red}{F}&T&\color{blue}{F}&\color{red}{F}&T\\ T&F&\color{red}{F}&T&\color{blue}{T}&\color{red}{T}&F\\ F&T&\color{red}{T}&F&\color{blue}{T}&\color{red}{F}&T\\ F&F&\color{red}{T}&F&\color{blue}{T}&\color{red}{T}&F \end{array} \]
The table shows the truth value of \(\neg P\vee\neg R\) under each interpretation of \(P\) and \(R\)
Exercise
See book, Ex. 3.31, pp.115, #1 (\(P\to \lnot R\))
Truth-Table Analysis
Truth-Table Analysis
Contingency, Tautology, Contradiction
Contradiction
- The number is both even and not even.
- Tek is my friend and not my friend.
Tautology
- The student passed or did not pass.
- If it is snowing, then it is snowing.
Contingency
- Tek passed his logic class.
- I am 6’0 tall.
Contingency, Etc: Why Care?
- Tautologies are T and contradictions are F in virtue of their form.
- No need to check the real world if they are T or F.
- For contingencies, we need to check the real world.
How to Test
Tables can check whether \(\phi\) is a contradiction, tautology, or contingency:
- Construct the table.
- Check whether the wff is
- F under every interpretation (contradiction),
- T under every interpretation (tautology),
- Neither a contradiction nor a tautology (contingency)
Test your knowledge
You will see a table and be asked: is it a tautology, contradiction, or contradiction?
graph LR
accTitle: Flowchart for proposition property
accDescr: A flowchart showing that if a table shows all T values, then it is a tautology. If the table shows all F values, then it is a contradiction. If the table shows some T values and some F values, then it is a contingency.
    w["wff"]
    Table["Table"]
    T["All T"] --> Taut["Tautology"]
    C["All F"] --> Contra["Contradiction"]
    Con["Some T and Some F"] --> Contin["Contingency"]
    w --> Table
    Table --> T
    Table --> C
    Table --> Con
Practice: \(\neg P\vee\neg R\)
Is \(\neg P\vee\neg R\) a PL-contingency, PL-tautology, or PL-contradiction?
\[ \begin{array}{c c|c c c c c} P&R&\neg&P&\vee&\neg&R\\ \hline T&T&F&T&F&F&T\\ T&F&F&T&T&T&F\\ F&T&T&F&T&F&T\\ F&F&T&F&T&T&F \end{array} \]
It is a PL-contingency.
Practice: \(P\vee\neg P\)
Is \(P\vee\neg P\) a PL-contingency, PL-tautology, or PL-contradiction?
\[ \begin{array}{c|c c c c} P&P&\vee&\neg&P\\ \hline T&T&T&F&T\\ F&F&T&T&F \end{array} \]
This wff is a tautology.
Practice: \(P\wedge\neg P\)
Is \(P\wedge\neg P\) a PL-contingency, PL-tautology, or PL-contradiction?
\[ \begin{array}{c|c c c c} P&P&\wedge&\neg&P\\ \hline T&T&F&F&T\\ F&F&F&T&F \end{array} \]
This wff is a contradiction.
Practice: An English Example
- It is not the case that if Liz does not eat ice cream, then she does not eat cake.
- Translate as \(\neg(\neg I\rightarrow\neg C)\).
- Create the table for \(\neg(\neg I\rightarrow\neg C)\).
- Check whether the wff is a PL-contingency, PL-tautology, or PL-contradiction.
Continued
\[ \begin{array}{c c|c c c c c c c} I&C&\neg&( &\neg&I&\rightarrow&\neg&C )\\ \hline T&T&F&&F&T&T&F&T\\ T&F&F&&F&T&T&T&F\\ F&T&T&&T&F&F&F&T\\ F&F&F&&T&F&T&T&F \end{array} \]
- Look under the leftmost negation
- Notice some Ts and some Fs.
- \(\neg(\neg I\rightarrow\neg C)\) is a PL-contingency.
Exercise
See book, Ex. 3.33, pp.122, #6: \(\lnot (P\vee \lnot R)\)
Consistency and Inconsistency
Consistency
- We are friends. You have brown hair. It is sunny.
- I will raise taxes. I will improve public services (e.g., better roads, schools, etc.)
Inconsistency
- My grade in Logic is good.
- I have a D in Logic.
- To have a good grade in logic, you must have a C or better.
Consistency: Why Care?
- Promises: Can the politician make good on all their promises?
- Scientific Theory: If a scientific theory predicts we will see \(X\) but we don’t see \(X\).1
- Philosophical-Religious Beliefs: God and the existence of evil or God and free will
- Run-of-the-mill claims: My friend who says “every movie is his favorite movie.”
Consistency: Obvious or Not?
In many cases, we can simply see that a set of wffs is PL-consistent.
- The wffs in the set \(\{P, Q\}\) are PL-consistent.
- Case: \(\mathscr{I}(P)=T\) and \(\mathscr{I}(Q)=T\).
In other cases, it is not obvious.
- Are \(P\vee Q\) and \(\neg(P\wedge Q)\) PL-consistent?
- What about \(\neg P\vee Q\) and \(\neg(P\wedge Q)\)?
- What about \(\neg P\vee(Q\vee\neg R)\) and \(\neg(P\leftrightarrow Q)\)?
Testing Consistency
- Create the table
- Check whether there is at least one row where all the wffs are \(T\).
- If there is such a row, the wffs are consistent.
- If there is no such row, the wffs are inconsistent.
Test your knowledge
You will see a table and will be asked: is the set of wffs consistent or inconsistent?
graph LR
    w[$$\Gamma$$] --> A["Table"]
    A["Table"] --> B["At least one row where all wffs are T"]
    B --> C{Yes}
    B --> D{No}
    C --> E["Consistent"]
    D --> F["Inconsistent"]
Consistency: Test 1
Test whether \(P\rightarrow Q\), \(P\wedge Q\), and \(P\vee\neg Q\) are PL-consistent.
\[ \begin{array}{c c|c c c|c c c|c c c c} P&Q&P&\rightarrow&Q&P&\wedge&Q&P&\vee&\neg&Q\\ \hline T&T&T&T&T&T&T&T&T&T&F&T\\ T&F&T&F&F&T&F&F&T&T&T&F\\ F&T&F&T&T&F&F&T&F&F&F&T\\ F&F&F&T&F&F&F&F&F&T&T&F \end{array} \]
In the first row, all three wffs true. Therefore, the set is PL-consistent.
Consistency: Test 2
Are \((P\rightarrow Q)\), \((\neg R\vee Q)\), and \((R\wedge\neg Q)\) PL-consistent?
\[ \begin{array}{c c c|c c c|c c c|c c c} P&Q&R&P\rightarrow Q&\neg R\vee Q&R\wedge\neg Q\\ \hline T&T&T&T&T&F\\ T&T&F&T&T&F\\ T&F&T&F&F&T\\ T&F&F&F&T&F\\ F&T&T&T&T&F\\ F&T&F&T&T&F\\ F&F&T&T&F&T\\ F&F&F&T&T&F \end{array} \]
There is no row where all the wffs are \(T\), so the set is PL-inconsistent.
Consistency: Obvious or Not Obvious
- Obvious: “John is tall” and “Mary is tall” are consistent. They can both be true.
- Not so obvious: “If John is tall, then Mary is happy” and “John is not tall or Mary is happy.”
Continued
\[ \begin{array}{c c|c c c|c c c c} J&M&J&\rightarrow&M&\neg&J&\vee&M\\ \hline T&T&T&T&T&F&T&T&T\\ T&F&T&F&F&F&T&F&F\\ F&T&F&T&T&T&F&T&T\\ F&F&F&T&F&T&F&T&F \end{array} \]
There is at least one row where both wffs are true. Thus, the sentences are PL-consistent.
FAQs about Consistency
Exercise
See book, Ex. 3.34, pp.125-6, #8: \(\neg P\to R, R\to\neg P\)
Summary
What we know
- how to create truth tables
- how to check whether wff \(\phi\) is a contradiction, tautology, or contingency.
- how to check whether a set of wffs \(\Gamma\) is consistent or inconsistent
flowchart TD
    T["Truth table"] --> w["wff"]
    T["Truth table"] --> s["set of wffs"]
    T["Truth table"] --> a["argument"]
    w --> c["contradiction, tautology, or contingency"]
    s --> i["consistent or not"]
    s --> e["equivalent or not"]
    a --> v["valid or invalid"]

    classDef done fill:#e1f5ff,stroke:#0277bd,color:#000
    class c,i done
TODO
- a set of wffs \(\Gamma\) is equivalent or not equivalent
- an argument is valid or invalid
flowchart TD
    T["Truth table"] --> w["wff"]
    T["Truth table"] --> s["set of wffs"]
    T["Truth table"] --> a["argument"]
    w --> c["contradiction, tautology, or contingency"]
    s --> i["consistent or not"]
    s --> e["equivalent or not"]
    a --> v["valid or invalid"]

    classDef done fill:#e1f5ff,stroke:#0277bd,color:#000
    classDef todo fill:#fff3e0,stroke:#f57c00,color:#000
    class c,i done
    class e,v todo
Four Takeaways
- Definition of PL-equivalence
- How to use a table to check if \(\phi, \psi\) are PL-equivalent.
- Definition of semantic entailment (\(\Gamma\models\psi\))
- How to use a table to check whether \(\Gamma\models\psi\)
Equivalence
Equivalence
- There is cake and there is ice cream.
- There is ice cream and there is cake.
Why Care? Personal Attack?
- This part of your paper could be improved
- You are an idiot.
Why Care? False expectations
- We might go to McDonald’s.
- We will probably go to McDonald’s.
Why Care? Public perception
- Tek is not guilty of murder.
- Tek is innocent of murder.
Testing equivalence
- Construct a single truth table for \(\phi, \psi\)
- Go row by row and check whether \(v(\phi) = v(\psi)\).
- If \(v(\phi) = v(\psi)\) for every row, then \(\phi\) and \(\psi\) are equivalent.
- If not, then \(\phi\) and \(\psi\) are not equivalent.
Testing equivalence diagram
flowchart TD
    P["$$\{\phi, \psi\}$$"] --> T["Table"]
    T --> mo["Look under main operator"]
    mo --> e1["T-values all match?"]
    e1 --> y["Yes"]
    y --> equiv["Equivalent"]

    e1 --> n["No"]
    n --> notequiv["Not equivalent"]
Equivalence: Test Your Knowledge 1
- Tek is not both in State College and Chicago.
- Translation: \(\lnot (S\land C)\)
\[ \begin{array}{c c|cc c c} S & C & \lnot & (S & \land & C) \\\hline T & T & \color{blue}{F} & T & T& T \\ T & F & \color{blue}{T} & T & F& F \\ F & T & \color{blue}{T} & F & F& T \\ F & F & \color{blue}{T} & F & F& F \\ \end{array} \]
F only when Tek is in two places at once (State College and Chicago)
Equivalence: Not Both
- Tek is not both in State College and Chicago.
- Translation: \(\lnot (S\land C)\)
\(v\lnot (S\land C)= v(\lnot S\lor \lnot C)\)?
TYK 1: Equivalence
- \(\lnot (S\land C)\)
- \(\lnot S\lor \lnot C\)
\[ \begin{array}{c c|cc c c|ccc c c} S & C & \lnot & (S & \land & C) & \lnot & S & \lor & \lnot & C\\ \hline T & T & \color{blue}{F} & T & T & T & F & T & \color{blue}{F} & F & T\\ T & F & \color{blue}{T} & T & F & F & F & T & \color{blue}{T} & T & F\\ F & T & \color{blue}{T} & F & F & T & T & F & \color{blue}{T} & F & T\\ F & F & \color{blue}{T} & F & F & F & T & F & \color{blue}{T} & T & F \end{array} \]
Yes. They are PL-equivalent.
Equivalence: Test Your Knowledge 2
- “Not both S and C” is \(\lnot (S\land C)\)
- “Not S and C” is \(\lnot S\land C\)
Equivalence: Not S and C
\[ \begin{array}{c c|cc c c|ccc c} S & C & \lnot & (S & \land & C) & \lnot & S & \land & C\\ \hline T & T & \color{blue}{F} & T & T & T & F & T & \color{blue}{F} & T\\ T & F & \color{blue}{T} & T & F & F & F & T & \color{blue}{F} & F\\ F & T & \color{blue}{T} & F & F & T & T & F & \color{blue}{T} & T\\ F & F & \color{blue}{T} & F & F & F & T & F & \color{blue}{F} & F \end{array} \]
They are not PL-equivalent. The parentheses do matter.
- \(\lnot (S\land C)\) = Tek is not both in S.C. and Chicago.
- \(\lnot S\land C\) = Tek is not in S.C. and is in Chicago.
Equivalence: Test Your Knowledge 3
- If I buy a lottery ticket, then I will win. \(L\rightarrow W\)
- It is not the case that I will both buy a lottery ticket and not win. \(\neg (L\land \lnot W)\)
\[ \begin{array}{c c|c c c|c c cc} L&W&L&\to&W&\neg&(L&\land&\lnot&W)\\ \hline T&T&T&T&T&T&T&F&F&T\\ T&F&T&F&F&F&T&T&T&F\\ F&T&F&T&T&T&F&F&F&T\\ F&F&F&T&F&T&F&F&T&F\\ \end{array} \]
The wffs are PL-equivalent.
Exercise
- From the book, Ex 3.36, pp.129. #5
Validity and Semantic Entailment
Semantic entailment
flowchart TD
    L["Logic"] --> B["Bad arguments"]
    L --> G["Good argument"]
    True["Truth"]
    R["Relevance"]
    G --> True
    G --> R
    G --> T
    T["C follows from Premises"] --> V["Validity"]
    V --> S["Semantic entailment"]

    classDef high fill:#e1f5ff,stroke:#0277bd,color:#000
    class T,V,S high
Notation Alert
The “models” symbol \(\models\) is used to express semantic entailment.
- When \(\Gamma\) semantically entails \(\psi\), write \(\Gamma\models\psi\)
- When \(\Gamma\) does not semantically entail \(\psi\), write \(\Gamma\not\models\psi\)
You can read \(A, B\models C\) as:
- A and B entails C.
- A and B semantically entails C.
- A and B therefore C.
Testing entailment
- Write down the wffs in the argument (ignore \(\models\))
- Construct the truth table.
- Check for a row where all elements of \(\Gamma\) are \(T\) and \(\psi\) is \(F\).
- If such a row exists, then \(\Gamma\not\models\psi\).
- If no such row exists, then \(\Gamma\models\psi\).
Testing entailment diagram
flowchart TD
    EngArg["English arg"] --> Arg["PL translation"]
    Arg --> Table["Table"]
    Table --> C
    C["Row where all Premises T and C is F?"]
    Y["Yes"]
    N["No"]
    C --> Y
    C --> N
    Y --> non["$$\Gamma\not\models\psi$$"]
    N --> ent["$$\Gamma\models\psi$$"]
Test Your Knowledge 1
- Argument: If Renna is happy, then she is singing. Renna is happy. Therefore, she is singing.
- Translation: \(R\to S, R\models S\)?
flowchart LR
    EngArg["English arg"] --> Arg["PL translation"]
    Arg --> Table["Table"]
    Table --> C
    C["Row where all Premises T and C is F?"]
    Y["Yes"]
    N["No"]
    C --> Y
    C --> N
    Y --> non["$$\Gamma\not\models\psi$$"]
    N --> ent["$$\Gamma\models\psi$$"]
    classDef done fill:#e1f5ff,stroke:#0277bd,color:#000
    class EngArg,Arg done
TYK 1: Entailment
\[ \begin{array}{c c|c c c|c|c} R&S&R&\to&S&R&S\\ \hline T&T&T&\color{blue}{T}&T&\color{blue}{T}&\color{red}{T}\\ T&F&T&\color{blue}{F}&F&\color{blue}{T}&\color{red}{F}\\ F&T&F&\color{blue}{T}&T&\color{blue}{F}&\color{red}{T}\\ F&F&F&\color{blue}{T}&F&\color{blue}{F}&\color{red}{F} \end{array} \]
- There is no row where \(R\to S\) and \(R\) are both T and \(S\) is F.
- \(R\to S,R\models S\).
TYK2: Entailment
- You can take biology or you can take chemistry. You can take biology. Therefore, it is not the case that you can take chemistry.
- Translation: \(B\vee C, B\models \lnot C\)?
\[ \begin{array}{c c|c c c|c|cc} B&C&B&\vee&C&B&\lnot & C\\ \hline T&T&T&T&T&T&F&T\\ T&F&T&T&F&T&T&F\\ F&T&F&T&T&F&F&T\\ F&F&F&F&F&F&T&F \end{array} \]
TYK3: Entailment
- P1. If my car is running, it has gas.
- P2. My car has gas.
- C: Therefore, my car is running.
Translation: \(R\to G, G\models R\)
TYK3: Entailment (continued)
\[ \begin{array}{c c|ccc |c|c} R&G&R&\to&G&G &R\\ \hline T&T&T&T&T&T&T&\\ T&F&T&F&F&F&T&\\ F&T&F&T&T&T&F&\\ F&F&F&T&F&F&F&\\ \end{array} \]
Exercise 1
From book, Ex.3.38, p.133, #4: \(P\lor Q\models P\)
Exercise 2
From book, Ex.3.38, p.133, #11: \(J\leftrightarrow C, C\models J\lor \lnot\lnot C\)
Limitations of Truth Tables
Problem 1: All valid arguments
flowchart TD
    A["English argument"] --> L["PL - translation"]
    L --> T["Table Test"]
    T --> V["Valid"]
    V --> A
    T --> I["Invalid"] --> Av["Actually valid"]

    classDef bad fill:#ffbab5,stroke:#ff1100,color:#000
    classDef good fill:#b3beff,stroke:#1c3dfc
    class Av,I bad
    class V good
Problem 1: Example
- P1: All humans are mortal.
- P2: Tek is a human.
- C: Therefore, Tek is mortal.
No “and”, “or”, “not”, “if… then…”, etc. to translate:
- P1: \(H\)
- P2: \(T\)
- C: \(M\)
Solutions to Problem 1
- Develop a more powerful logical language.
- We will do this later in the course.
Problem 2
Suppose I asked you to construct a truth table for the following:
\(P\to (Q\land R), (R\land T)\leftrightarrow W,\) \(W\lor \lnot (S\land T), \lnot (C\land D) \models A\land (B\lor C)\)
Problem 2: Exponential increase
For each new propositional letter \(n\), the table grows \(2^n\)
import matplotlib.pyplot as plt

n = list(range(1, 11))
rows = [2**k for k in n]

fig, ax = plt.subplots(figsize=(10, 5))
ax.plot(n, rows, marker="o", linewidth=2.5, color="#2C7FB8")

for letters, count in zip(n, rows):
    ax.annotate(
        f"{count:,}",
        (letters, count),
        xytext=(0, 8),
        textcoords="offset points",
        ha="center",
        fontsize=12,
    )

ax.set_title(r"Truth-table size grows exponentially: $2^n$")
ax.set_xlabel("Number of propositional letters ($n$)")
ax.set_ylabel("Number of rows ($2^n$)")
ax.set_xticks(n)
ax.grid(True, axis="y", alpha=0.3)
ax.spines[["top", "right"]].set_visible(False)
fig.tight_layout()
plt.show()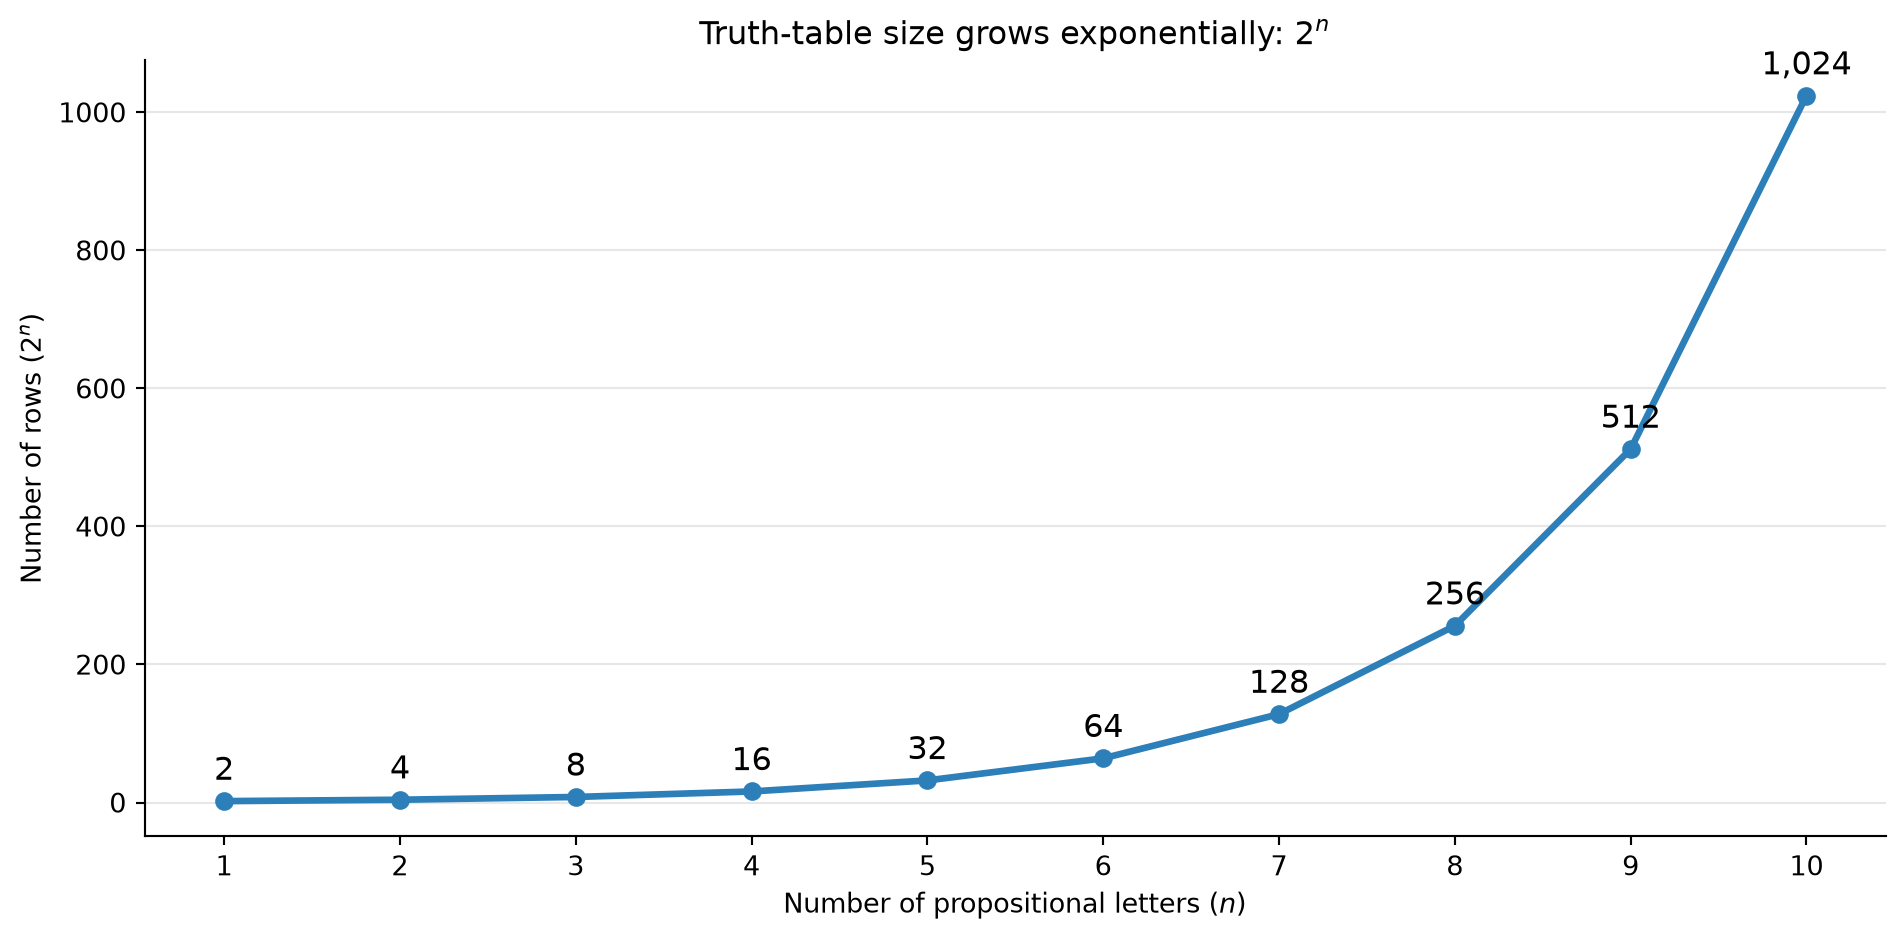
Solutions to Problem 2
- Solution 1: Create a New Test!
- Solution 2: Use computers
Footnotes
Example: Newton’s laws of universal gravitation and Mercury’s orbit.↩︎